> ## Documentation Index
> Fetch the complete documentation index at: https://docs.anymorph.ai/llms.txt
> Use this file to discover all available pages before exploring further.
# Reading the numbers
> Which metric answers which question, and the places people usually get tripped up
Anymorph has several numbers that look alike. This page is a cheat sheet for picking the right one for the question you actually have.
## The five numbers
| Metric | What it measures | Good direction | Where you see it |
| ------------------------ | --------------------------------------------------------------------- | ------------------- | -------------------- |
| **Mention rate** | Share of AI answers that name your brand | Higher is better | Visibility, Overview |
| **Mention rank** | How early you're named in the answer (1 = first) | **Lower is better** | Visibility, Overview |
| **Share of Voice (SoV)** | Your slice of the brand conversation, weighted by position and length | Higher is better | Visibility, Overview |
| **Citations** | Source links AI answers leaned on | Higher is better | Citation, Visibility |
| **Performance** traffic | Real visits arriving from an AI engine | Higher is better | Performance |
The first three tell you **how AI talks about you**. **Citations** tells you **what AI read to say it**. **Performance** tells you **whether anyone actually showed up**.
## Which number for which question
| What you want to know | The number | The screen |
| ---------------------------------------- | -------------------------------------------- | ------------------------------------- |
| How often does AI bring us up? | **Mention rate** | [Visibility](/dashboard/visibility) |
| When we're named, how early? | **Mention rank** | [Visibility](/dashboard/visibility) |
| How do we sit against competitors? | **Share of Voice (SoV)** | [Visibility](/dashboard/visibility) |
| Which topics are we losing? | **Gaps to win** in **Mention rate by topic** | [Visibility](/dashboard/visibility) |
| Which sites does AI read to answer this? | **Citations** | [Citation](/dashboard/citation) |
| Where should we get placed next? | The **Type** filter on Citation | [Citation](/dashboard/citation) |
| Did our content actually bring visitors? | AI referral traffic | [Performance](/dashboard/performance) |
| Why did any of this happen? | The full AI answers | [Mentions](/dashboard/mentions) |
## Don't get the direction backwards
**Mention rank** is the only one where lower is better. Moving from `#2.4` to `#1.8` is an improvement. The screen flips the colour of that metric's change badge for exactly this reason, so green always means "better".
Everything else: higher is better.
Your **Mention rate** can be good while your **Mention rank** is poor, and vice versa. That's the difference between being named often but always last, and being named rarely but first when it happens. Read the two together.
## The period-comparison trap
There are two different kinds of change figure in the product, and they sit close enough together to confuse people.
| Where you see it | What it compares against |
| --------------------------------------------------------------------- | ------------------------------------------------------------------------------------------------------------ |
| The badge next to Visibility's big number, and Overview's card badges | The **immediately preceding window of the same length**. On 7d, the previous 7 days; on 90d, the previous 90 |
| The **vs last week** column in **Mention rate by topic** | The **last measured day minus the first measured day inside the window you're looking at** |
That topic column isn't "this topic versus last week". It's **"is this topic trending up or down inside this window"**. The two figures moving differently is not a bug — they answer different questions.
One more thing: if the previous window had no measurement at all, the change is left blank rather than shown as 0. A **—** means "couldn't be read", not "flat".
## Change the prompts and every number moves
Every metric is calculated against **the questions you track**. Change the questions and the denominator changes, so the numbers move even when nothing changed for the brand.
Don't read across a prompt panel version change as one trend line. A new version asks different questions. It isn't the same measurement. Compare within a version.
Two ways to check:
* On [Overview](/dashboard/overview), read the **Measurement basis** strip. If **Prompt changes** is not zero, or there's a **v\[n] published** badge, the question set changed inside the window you're looking at.
* On Visibility, hover the dashed vertical line on the chart. The tooltip names the change, e.g. **Prompt panel version changed**.
Region and topic filters change the denominator the same way. When you compare, keep the filters identical.
## A 15-minute weekly review
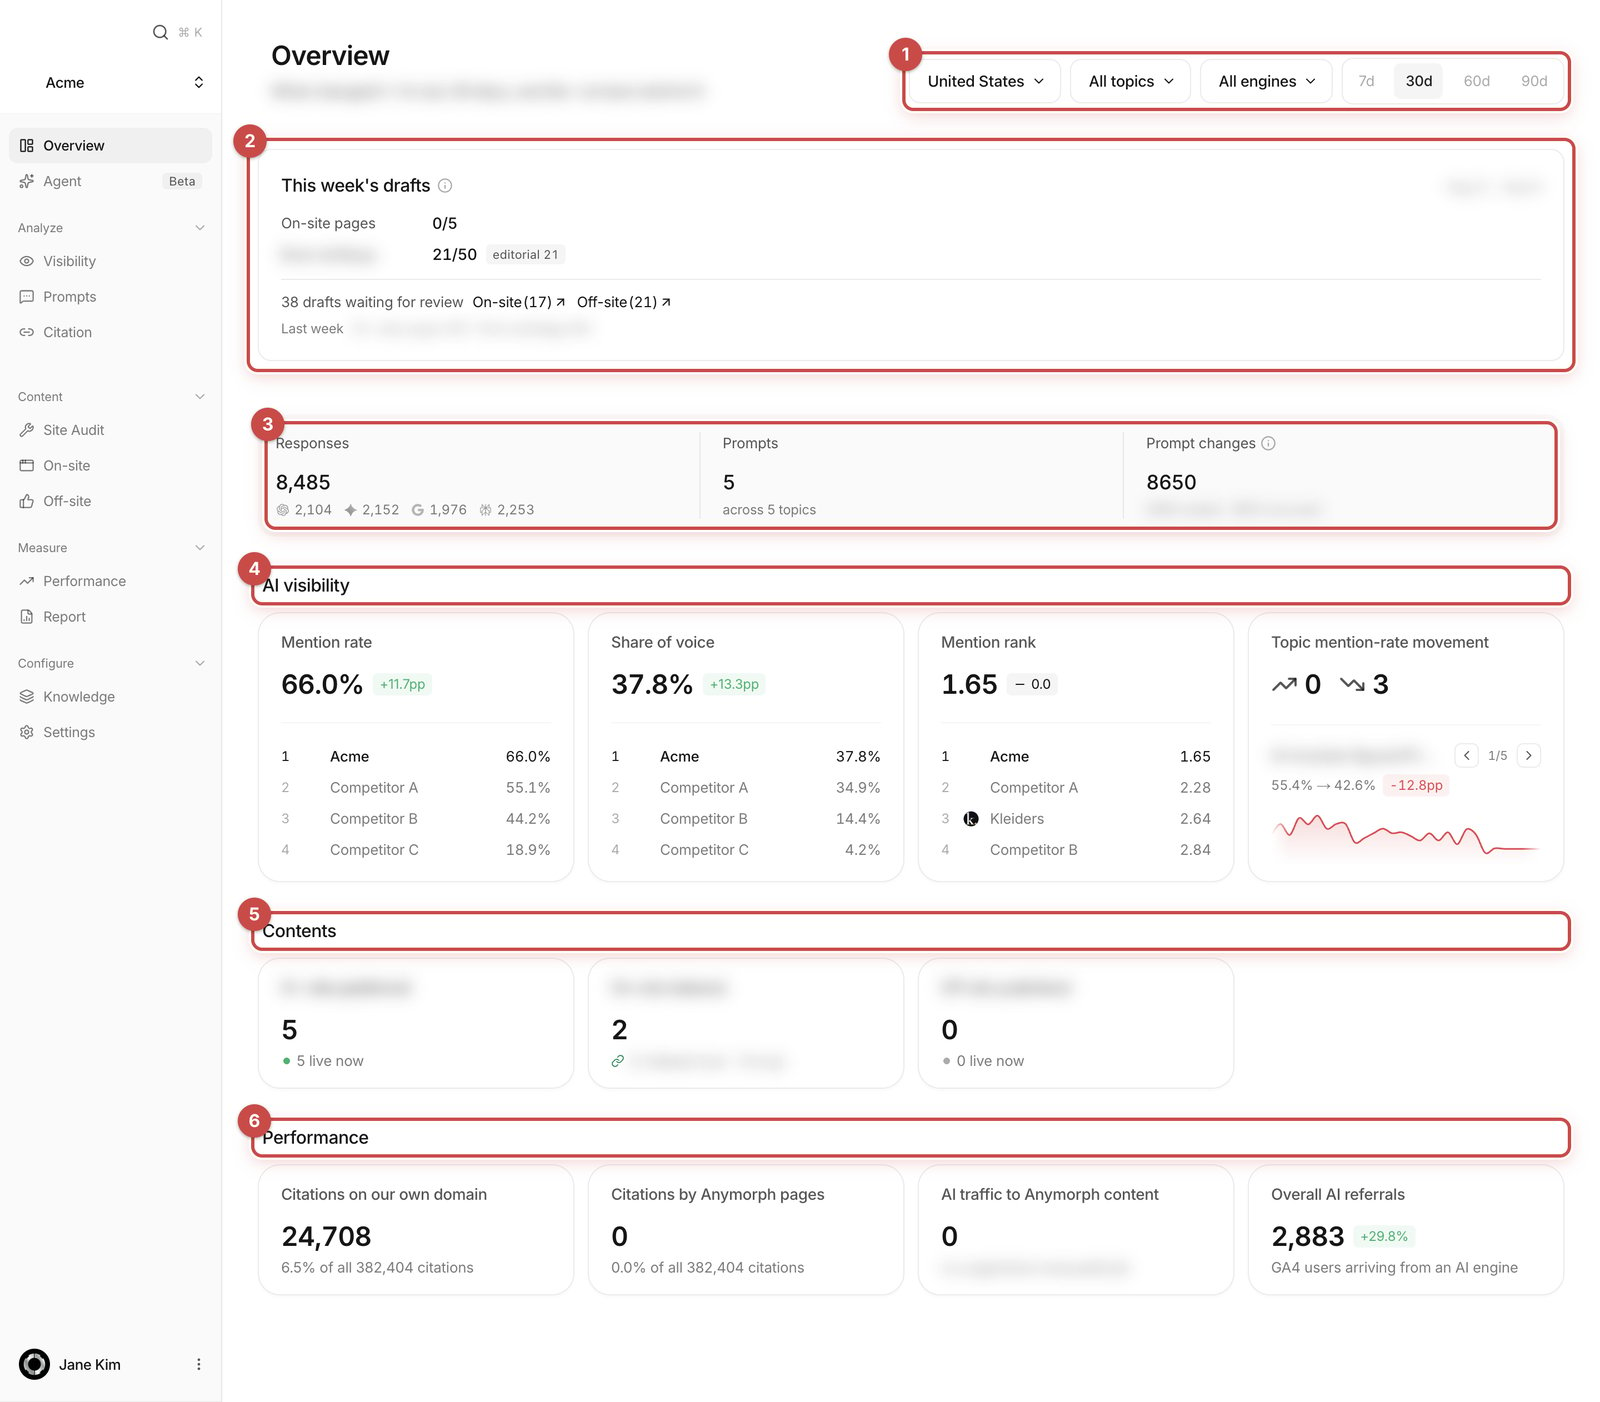 Read **This week's drafts** for what got written and how many drafts are waiting on you. Then check **Prompt changes** in the **Measurement basis** strip. If the question set changed this week, this week's movement isn't a like-for-like comparison.
Open [Visibility](/dashboard/visibility) with the period on **7d**. Read the big number and the **Share of Voice (SoV)** bar. Then in **Mention rate by topic**, click **Gaps** for the five topics where competitors lead you most.
On [Citation](/dashboard/citation), see which source type AI cites most. Filter the table to that type and work down by citation count — that's your shortlist of where to be next.
Back on Overview, click **On-site (n)** or **Off-site (n)** and review the drafts waiting for you.
Still asking "but why?" — open Visibility's lightbulb **Insights** panel and click a card's **Mentions** link. Reading the actual AI answers is the fastest way to find out.
## The monthly routine
Same order as the weekly one, but set the period to **30d**. The daily bounce washes out and the real trend shows.
On [Report](/dashboard/report), click **Download PDF** for a document you can share. Hit **Regenerate** first if you want it built on the latest analysis. Each workspace keeps one report — the latest.
On [Performance](/dashboard/performance), look at AI referral traffic and whether the pages you published are actually getting cited. The **Impact** tab shows whether mentions rose after a page went live.
## Things people commonly mix up
Mention rate is a **count**: what percentage of answers named you. SoV is a **share**: how much of the brand conversation was yours. SoV grows when you're named early and discussed at length. If you're always mentioned but only in one line at the very end, your rate is high and your SoV is low.
No. A **mention** is your brand name appearing in the answer text. A **citation** is a link the answer leaned on. An answer can cite your page without ever naming you. They count different things and will never match.
The one in the Mentions detail panel is your share **inside that single answer**. The one on Visibility is your share across every answer in the selected period. Same name, different numbers.
Their default periods differ — Overview starts at 30 days, Visibility at 7. The region, topic and engine filters are also set per screen. Match the filters before you compare.
It isn't tracked. Untracked brands still count in the **Mention rank** pool, so they can push your rank down, but they don't appear in **SoV** or on the scoreboard. Add it as a competitor in settings to bring it into the comparison.
It means the figure couldn't be read for that scope. It never means zero. Usually there was no measurement in the previous window, or that card's data source isn't connected, or the metric simply can't be measured per topic.
No. A prompt that names your brand is weighted at 10% of a normal one, and the topic breakdown excludes branded and comparison prompts entirely. To move the numbers you have to win the questions where nobody named you first.
## Related
Mention rate, mention rank and share of voice.
The sources AI answers pull from.
Read the AI answers themselves.
Traffic and results from published content.
Read **This week's drafts** for what got written and how many drafts are waiting on you. Then check **Prompt changes** in the **Measurement basis** strip. If the question set changed this week, this week's movement isn't a like-for-like comparison.
Open [Visibility](/dashboard/visibility) with the period on **7d**. Read the big number and the **Share of Voice (SoV)** bar. Then in **Mention rate by topic**, click **Gaps** for the five topics where competitors lead you most.
On [Citation](/dashboard/citation), see which source type AI cites most. Filter the table to that type and work down by citation count — that's your shortlist of where to be next.
Back on Overview, click **On-site (n)** or **Off-site (n)** and review the drafts waiting for you.
Still asking "but why?" — open Visibility's lightbulb **Insights** panel and click a card's **Mentions** link. Reading the actual AI answers is the fastest way to find out.
## The monthly routine
Same order as the weekly one, but set the period to **30d**. The daily bounce washes out and the real trend shows.
On [Report](/dashboard/report), click **Download PDF** for a document you can share. Hit **Regenerate** first if you want it built on the latest analysis. Each workspace keeps one report — the latest.
On [Performance](/dashboard/performance), look at AI referral traffic and whether the pages you published are actually getting cited. The **Impact** tab shows whether mentions rose after a page went live.
## Things people commonly mix up
Mention rate is a **count**: what percentage of answers named you. SoV is a **share**: how much of the brand conversation was yours. SoV grows when you're named early and discussed at length. If you're always mentioned but only in one line at the very end, your rate is high and your SoV is low.
No. A **mention** is your brand name appearing in the answer text. A **citation** is a link the answer leaned on. An answer can cite your page without ever naming you. They count different things and will never match.
The one in the Mentions detail panel is your share **inside that single answer**. The one on Visibility is your share across every answer in the selected period. Same name, different numbers.
Their default periods differ — Overview starts at 30 days, Visibility at 7. The region, topic and engine filters are also set per screen. Match the filters before you compare.
It isn't tracked. Untracked brands still count in the **Mention rank** pool, so they can push your rank down, but they don't appear in **SoV** or on the scoreboard. Add it as a competitor in settings to bring it into the comparison.
It means the figure couldn't be read for that scope. It never means zero. Usually there was no measurement in the previous window, or that card's data source isn't connected, or the metric simply can't be measured per topic.
No. A prompt that names your brand is weighted at 10% of a normal one, and the topic breakdown excludes branded and comparison prompts entirely. To move the numbers you have to win the questions where nobody named you first.
## Related
Mention rate, mention rank and share of voice.
The sources AI answers pull from.
Read the AI answers themselves.
Traffic and results from published content.